Use cases for the Historical Social Network of Chinese Buddhism Dataset
Marcus Bingenheimer
The evolving datasets offered here are prepared in formats that allow immediate use in open source SNA tools (such as Gephi or Cytoscape). They are offered (for now) in two formats .gephi and .gexf: The Gephi specific .gephi is a view of the lay-outed dataset, where nodes are already aligned vaguely along a horizontal timeline. If you have not used Gephi before, perhaps start with this. Gexf is a XML graph description standard, which contains the raw data, and which can easily be transformed into other graph data formats.
For an intro to Gephi see Ken Cherven Network Graph Analysis and Visualization with Gephi (2015), and Devangana Khokhar Gephi Cookbook (2015). Below a few use cases for the Historical Social Network of Chinese Buddhism.
- How to generate ego-networks in Gephi
- How to generate a dynamic network in Gephi
- How to import the data into Cytoscape
- How to integrate your own data in the Historical Social Network of Chinese Buddhism
Case 1: You are interested in person X (e.g. the famous 道宣 (596-667)) and want to know about his social network (according to the sources modeled in this dataset)
- Load the network into Gephi
- Get 道宣's Person ID from http://authority.dila.edu.tw/person/ (make sure to pick the right 道宣). (You can also search for the name in Gephi (under Data Laboratory > Search), but because of the many-to-many relationship of persons and names, using IDs is preferable.)
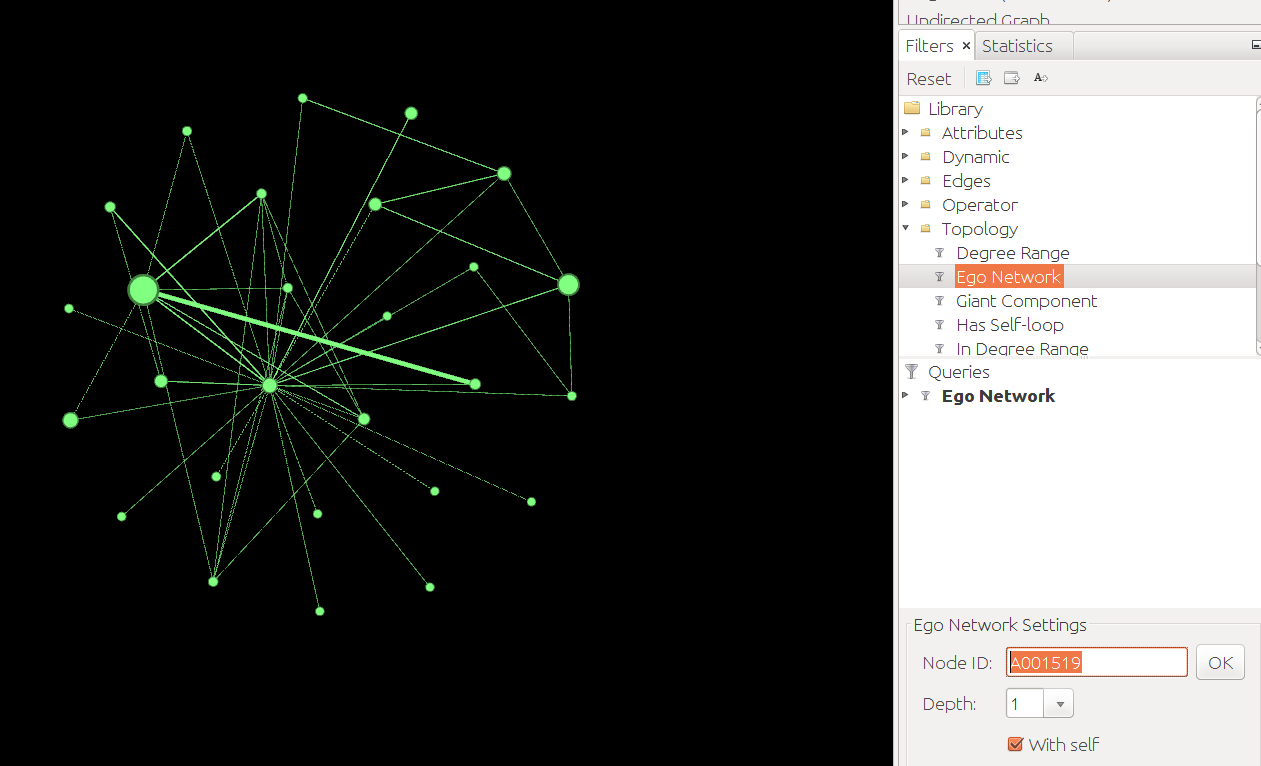
- Find the tab "Filters", go to Topology > Ego Network. Add Ego Network to Queries. Enter the Person ID (= Node ID), e.g. A001519 for 道宣. Click "OK":
- Extract this Ego Network (Data Laboratory > Export Table as csv. OR: Overview > Use the Select Tool > Right click > Move to new Workspace > File > Export as gexf).
- Layout the gexf and prettify:
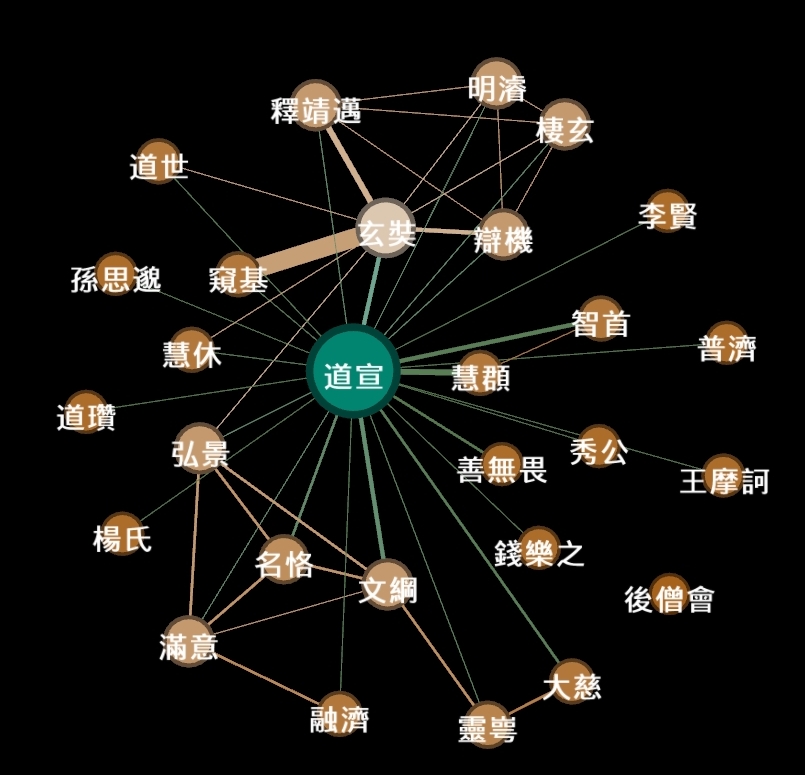
- This can be a starting point to think about Daoxuan in his time and social interactions. Try a 2 degree ego network to see friends of friends of Daoxuan. References to sources are as always in the Edge List (Data Laboratory).
Case 2: You are interested in viewing the unfolding of the network in a timeline view.
The simplest way to create a timeline slider is:
- In the Data Laboratory: Merge Columns > Choose: birthY and deathY > Merge Strategy: Create time interval > Begin: birthY, End: deathY > Parse numbers (0-2000) (I recommend this for now over parsing as dates)
- A time line button appears at the bottom > click to enable
- Switching back to Overview an adjustable timeline slider is now available
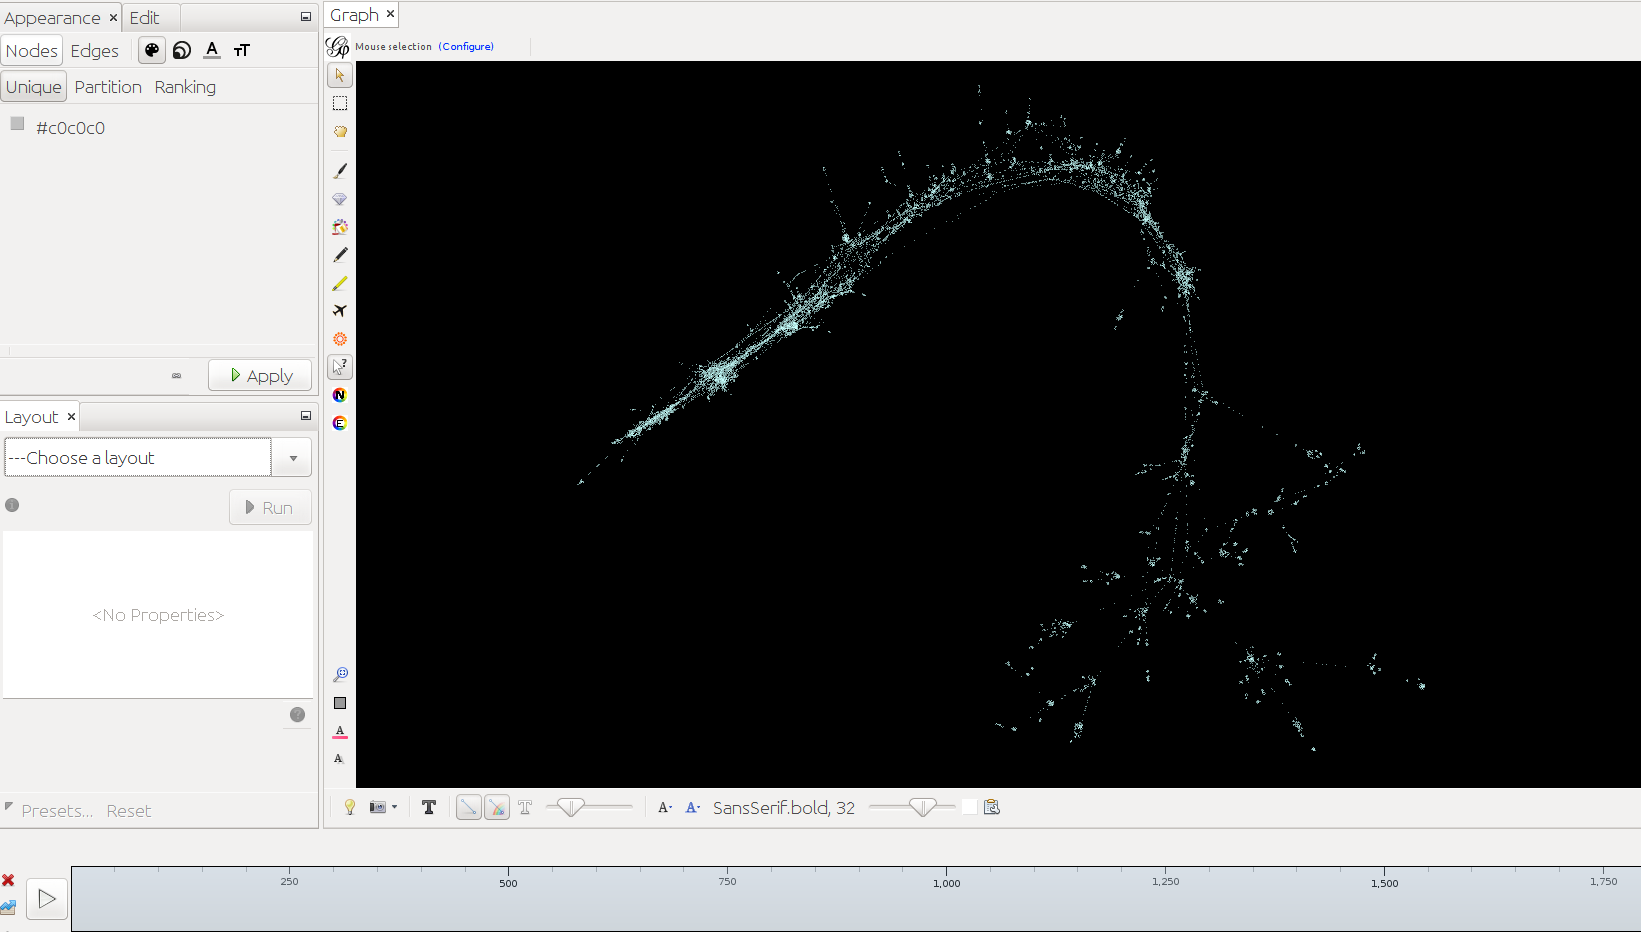
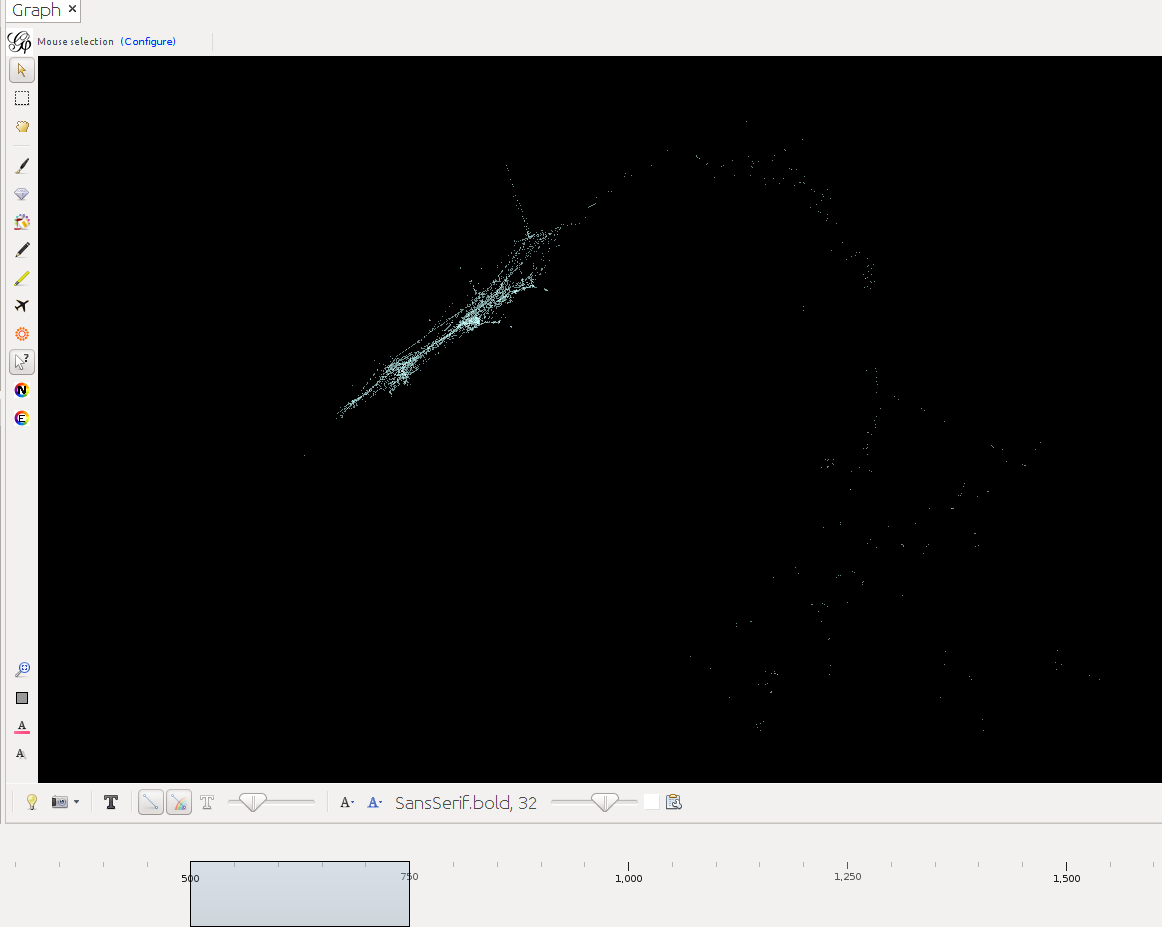
Below timeslider with the CB-HSNA dataset 2019-02. (Fig.1: Network 0-2000, Fig.2: 500CE-750CE, Fig.3: 1000CE-1250CE, Fig.4: 1500-1750).
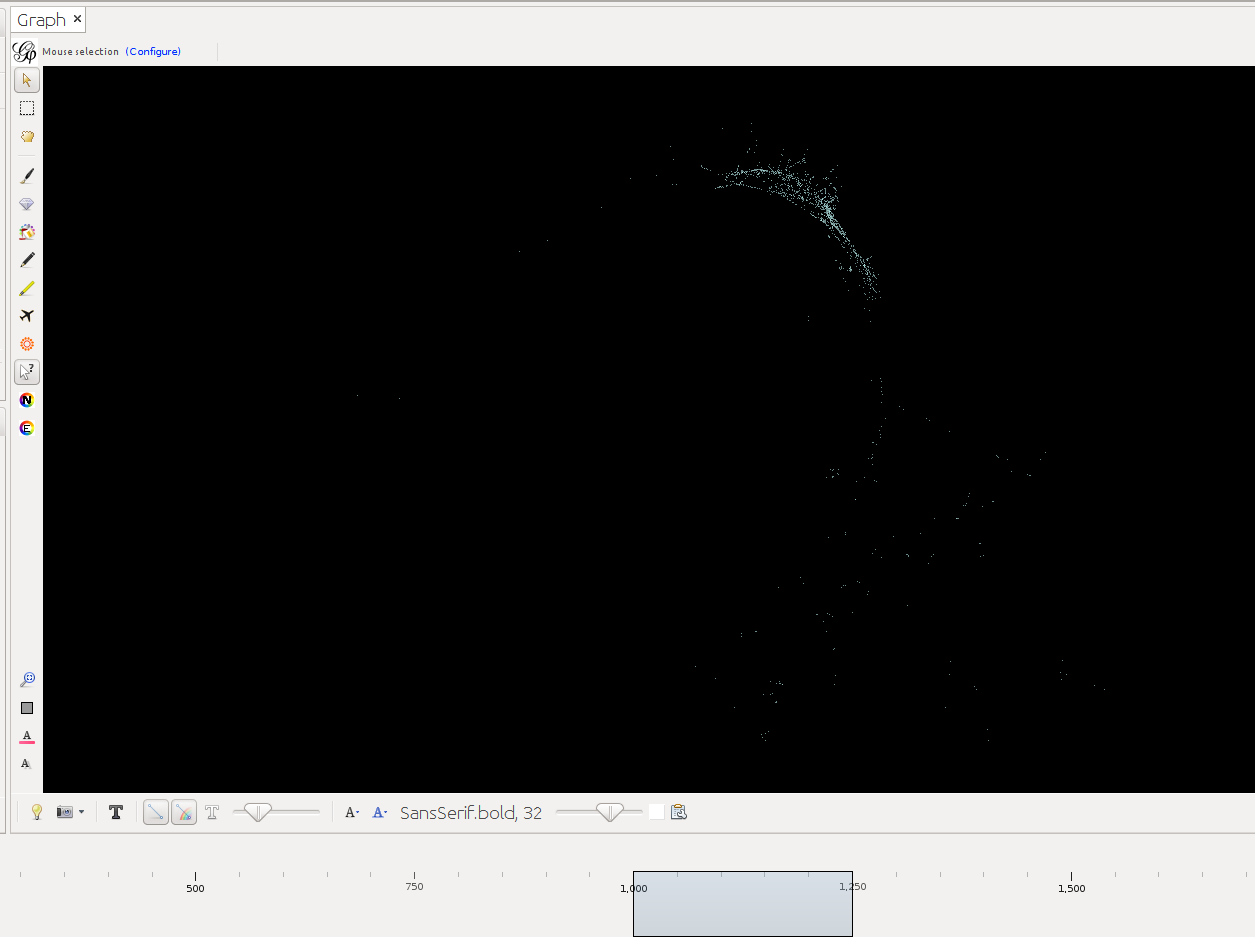
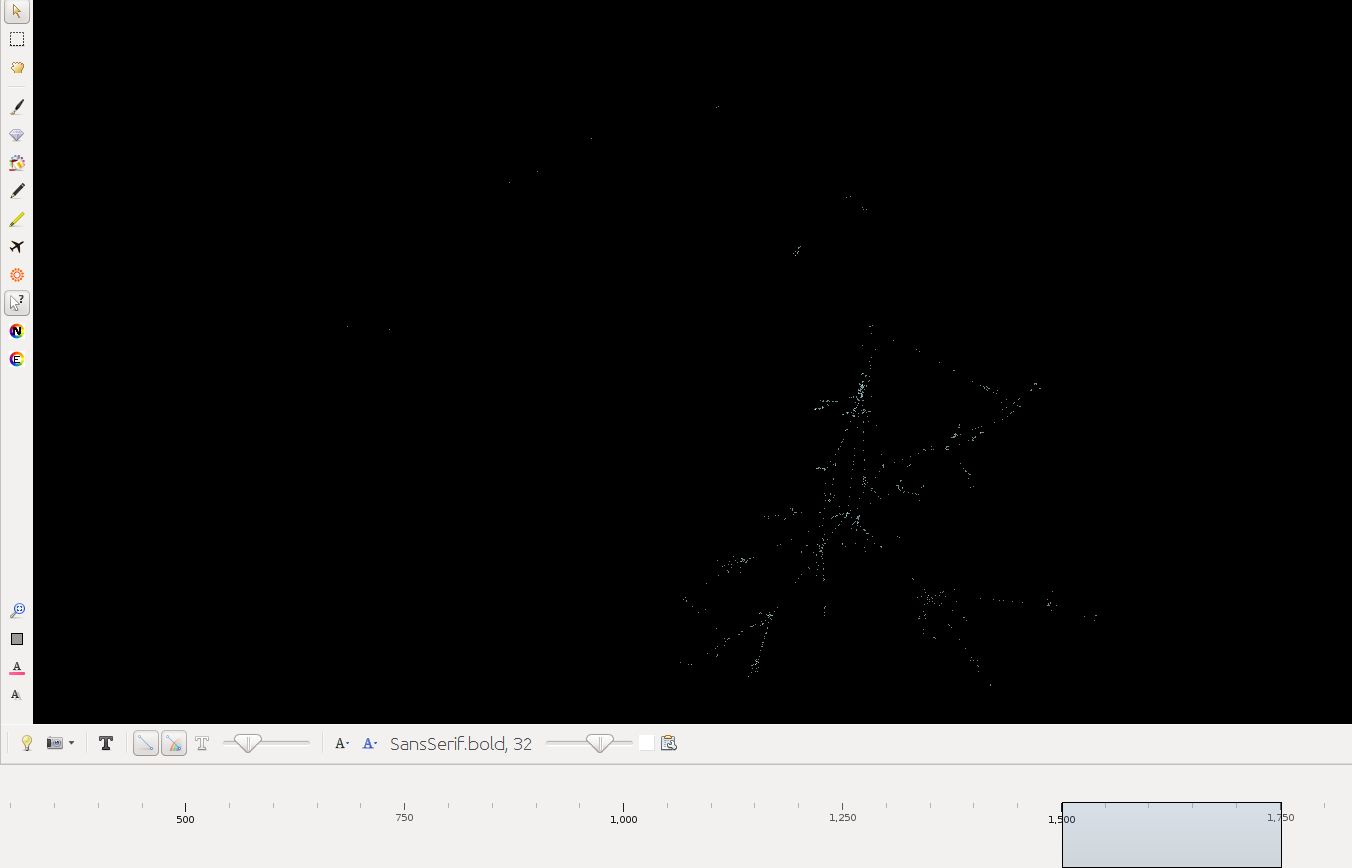
Note: For many actors birth and death dates are unknown (= Value 0 in the birthY/deathY columns). (There are no actors who are actually born/died in year 0.) The above strategy results in them manifesting at year 0 only. I.e. one can keep them in view if one only extends the timeslider to the right, while leaving it tethered left. Once the left end of the slider is moved the actors with neither birthY nor deathY will vanish. Actors with only birthY will appear after the slider moves across their birthY, but not end (birthY-2000), actors with only deathY will persist from year 0 to their deathY (0-deathY). Obviously this behavior can be changed by changing the 0 values in the respective columns.
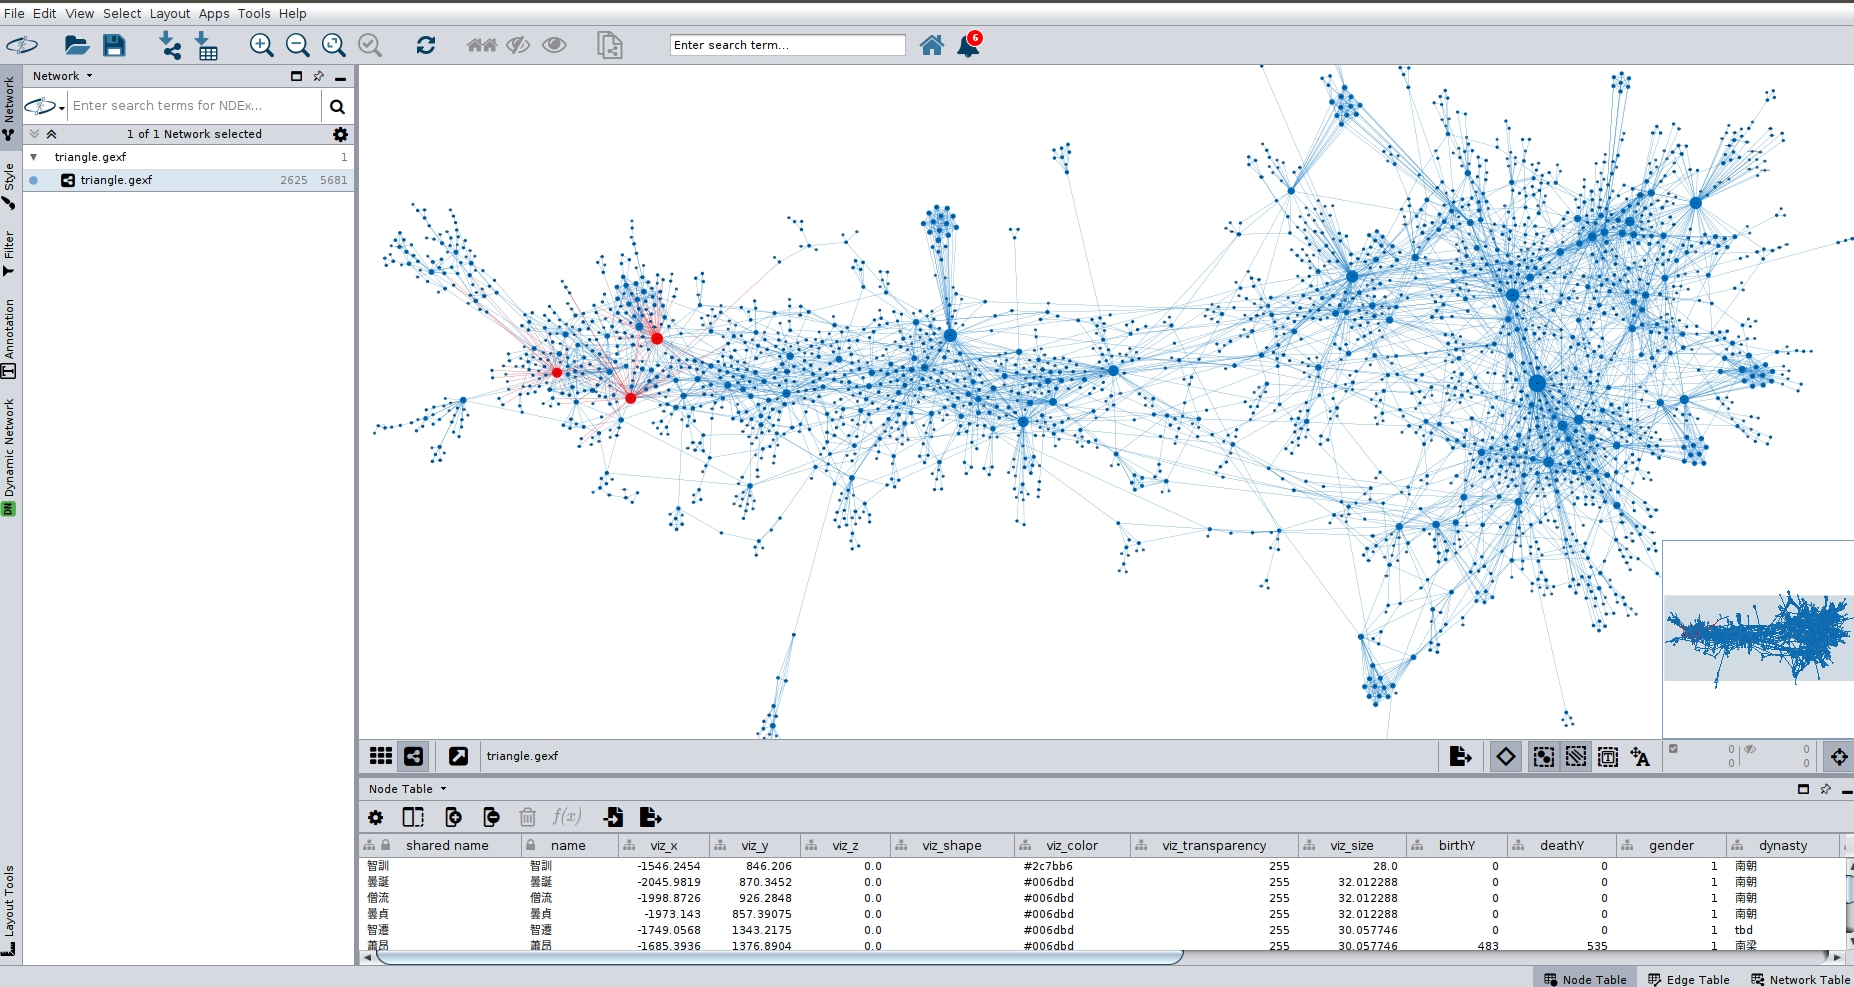
Case 3: You want to use the dataset in Cytoscape.
In order to import the .gexf version of the data into Cytoscape, you need to install the Cytoscape gexf-app plugin. Then: File->Import->Network from File.
It is possible to style and color a network in Gephi (0.9.2), save it to .gexf and import that into Cytoscape (3.8.0) with the color scheme and layout intact.
Though mainly geared to biochemistry, Cytoscape is useful for historical network analysis. Through its free "app store" users have access to a wide range of metrics, better annotation tools, and a working SVG export. It seems to see more development than Gephi these years.
Case 4: You want to add your own data to the HNCB.
For a meaningful integration at least some actors must appear in both networks, otherwise you would have two unconnected network regions. For the merge to work you must use the same ID scheme (effectively Dharma Drum Person Authority IDs) when collecting data.
- Get the Historical Network of Chinese Buddhism from github and load the .gephi file into Gephi.
- Delete the parts of the network you don't need manually. Selection tool -> right click on the region -> Delete. For more sophisticated deletions one might use Filters.
- Redo the layout as needed.
- Import the nodes and links (via Import Spreadsheet) in that order. Remember to click "Append to workspace" both times. That will in effect merge the two networks, i.e. nodes with the same ID will not be reduplicated, "new" nodes will be created. Result looks something like this:
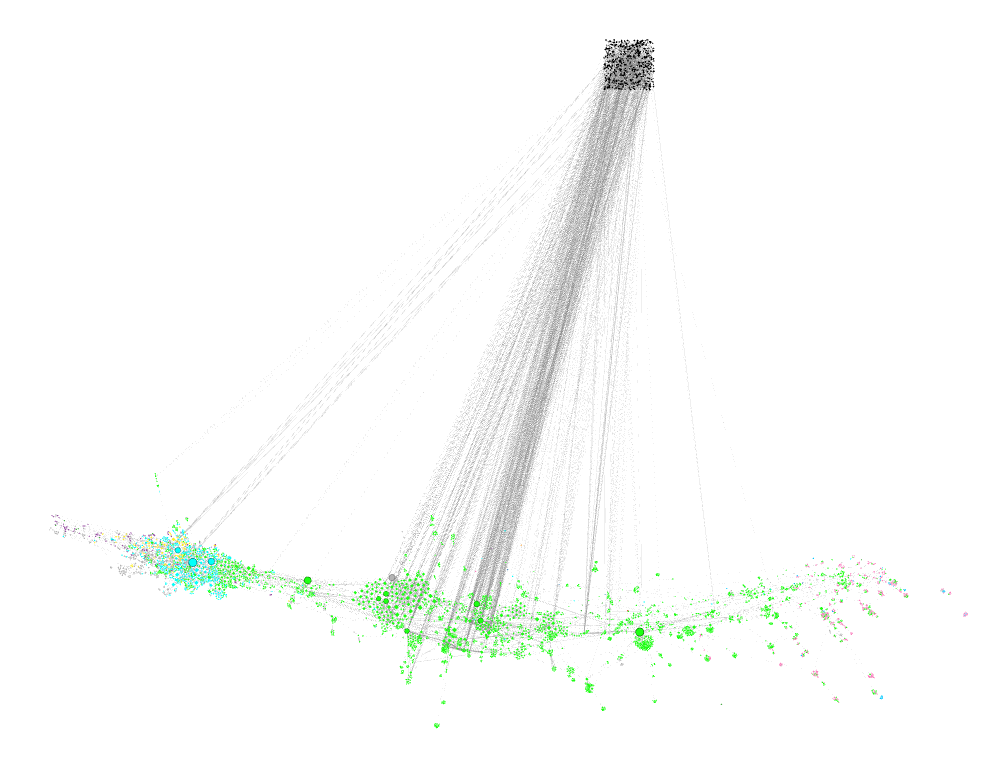
The black nodes in the upper part are new nodes that were not in the network before. They connect with the merged nodes which remain at their position in the network that was first loaded.
- This needs layouting to integrate the new nodes into the visualization. There are many choices here, depending on what you want to see.
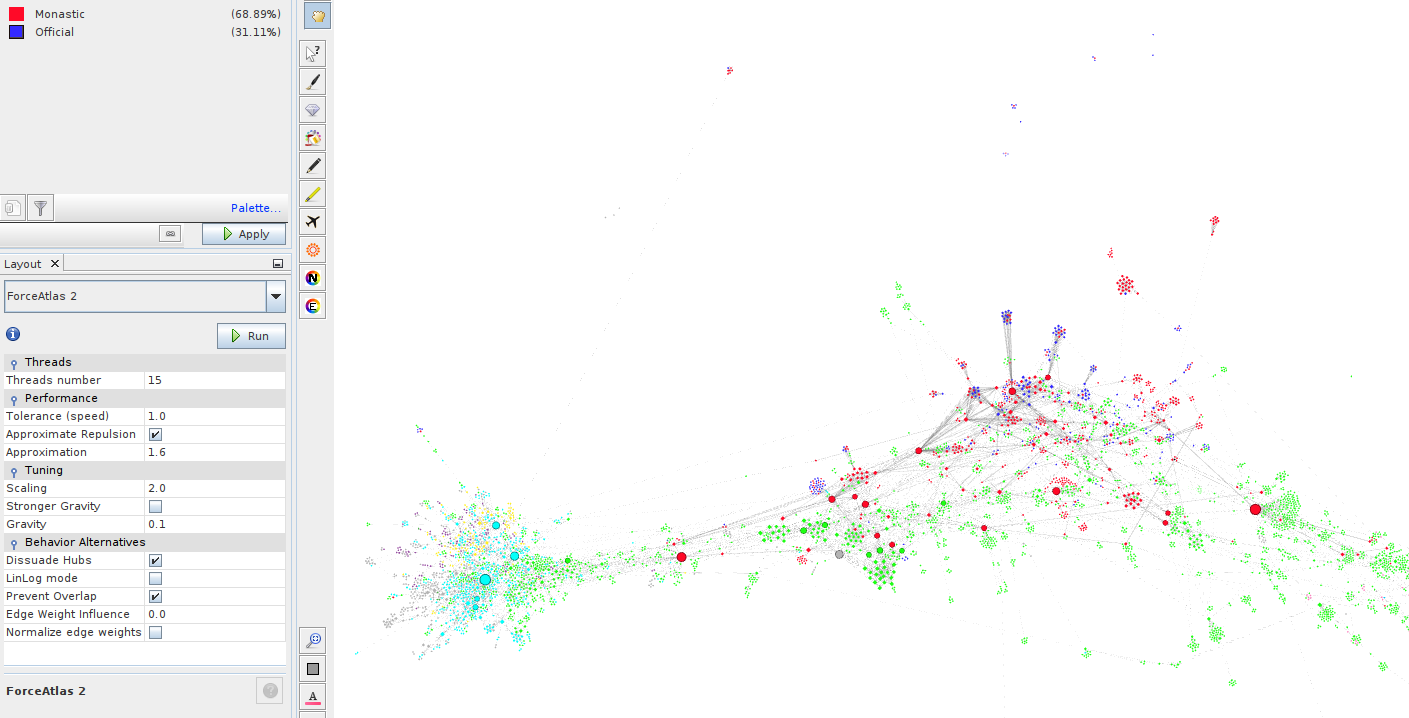
The image shows the "new" nodes, i.e. those added by the user, as either red or blue depending on whether they are monastics or officials. Thus "your" network has become part of the larger network.
home